Image Gallery
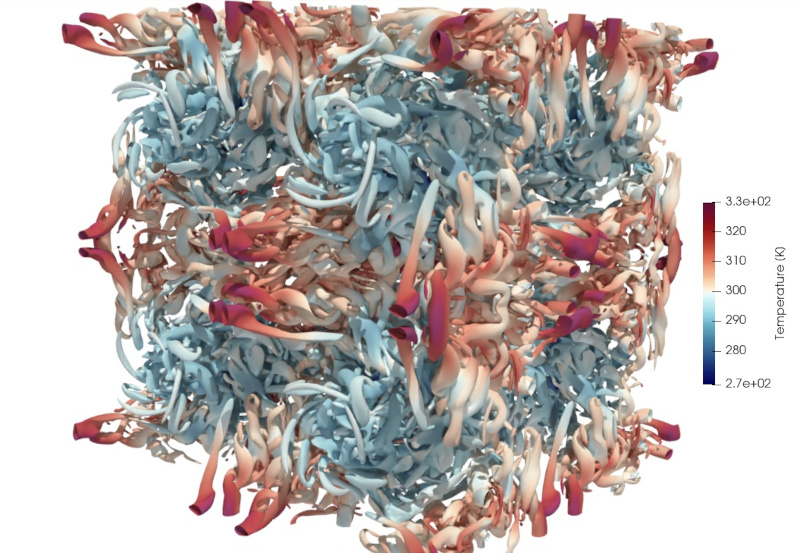
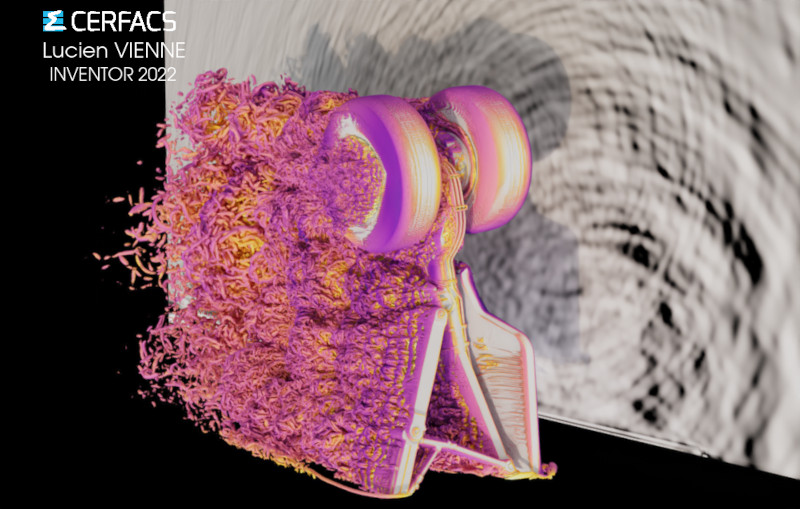
Below are some illustrations of my research. The postprocessing mainly involves Python scripts, Paraview and the Matplotlib library.
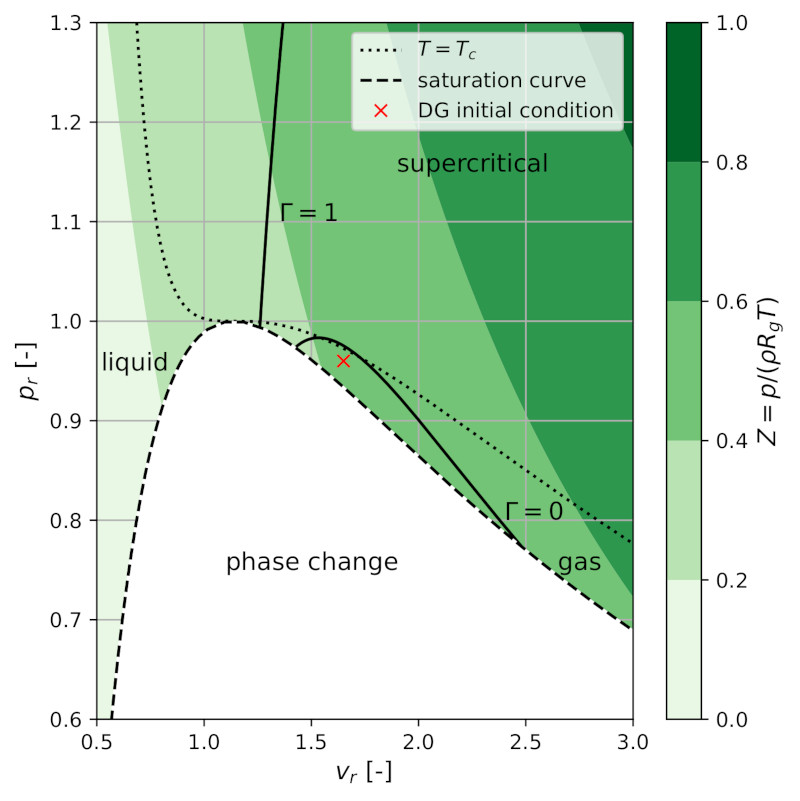
Reduced pressure-volume plot near the critical point of FC70 gas, computed using the Peng-Robinson equation of state. A small region where the fundamental derivative of gas, \(\Gamma\), is negative indicates the potential for non-classical shock dynamics. The compressibility factor, \(Z\), shown in shades of green, illustrates deviations from ideal gas behavior.